Pro Spike Flow, June: About Nineteen Times the Bill
In June 2026, Pro Spike Flow's store ran about nineteen times what we billed them for the month. Hit Harder is the platform we built to make numbers like that reproducible across clients.
For Pro Spike Flow, June was a single-month result that doesn't often make it into case studies. Adjusted orders on their store between June 1 and June 30 ran roughly nineteen times the retainer-and-overage we billed for the same month. We're not going to print the raw Shopify totals or the invoice cents — those are private. The multiple is the story.
That single month isn't a lifetime. It's not a since-launch blend. It's not folded in with earlier quarters, before we'd rebuilt the loop. It's one month, with a research-backed creative plan, against a single platform of attribution — paid social — and the result was about nineteen times what we invoiced for.
Why this month, and why the multiple is the headline
Case studies in our line of work tend to blend across quarters and quietly obscure the actual conversion path. We were doing that too, until we weren't. The shift happened because we stopped optimizing against the dashboard Meta hands you and started optimizing against the actual flow of intent through a store. Once you do that, the multiple is something you can publish. That isn't a secret, but it is unusual.
The math, in broad strokes that don't compromise client confidentiality: paid social drove the majority of attribution. Conversion rates in the broader session-to-order class sat around 2% — not the high double digits you'd see if you trusted platform-reported ROAS as the truth. The dashboard says one thing. The store says another. The decision the marketer is actually making is closer to what the store says.
That's how you get a single month that runs about nineteen times the bill. It isn't the entire story. It's the part of the story we can publish cleanly, and it tells you what kind of platform can produce it.
The ceiling you've been operating under
If you market on Meta, the dashboards are blunt on purpose. They tell you impressions, clicks, link clicks, add-to-carts, checkouts, purchases. They do not tell you, per cart drawer or per creative variant, what the contribution to revenue actually was. They do not tell you what a given button placement cost you in lost sales. They report aggregate ROAS, and aggregate ROAS is a number you can argue with all month and still not be able to defend in a board meeting.
That gap is the gap Hit Harder ships into. We started shipping per-store telemetry that captures the things Meta and Shopify blunt: the truth behind every click, the per-button attribution, the experiment result tied back to actual revenue. Cart drawers become readable. Creative variants become readable. The thing you've been guessing at becomes the thing you can pull.
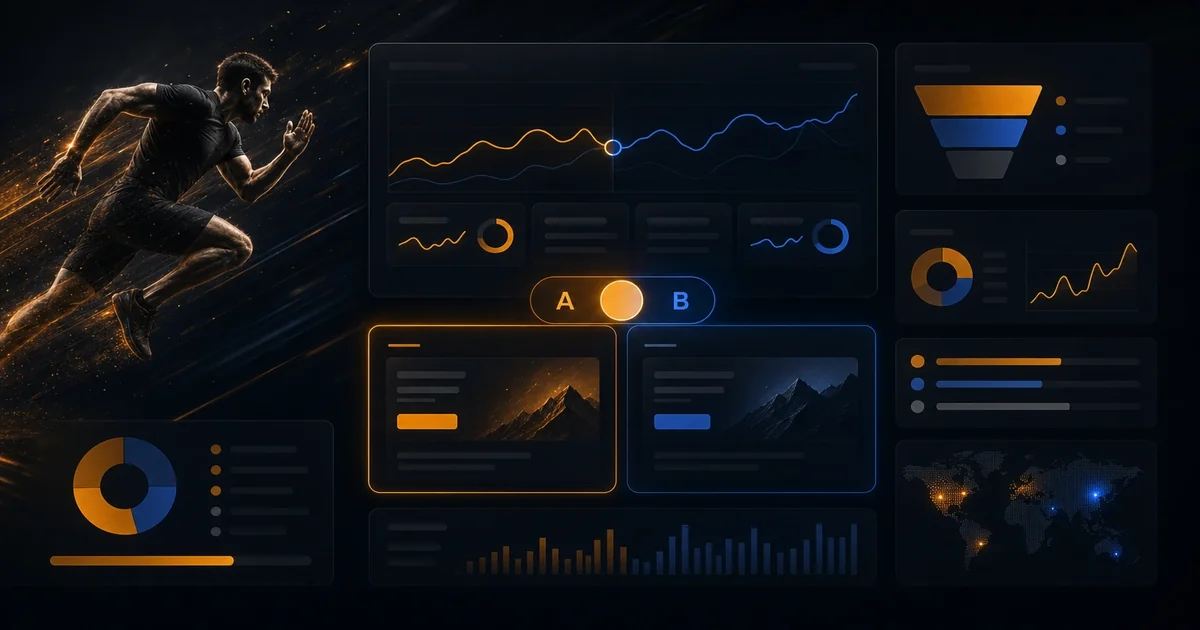
You can imagine the platform as a multi-tenant dashboard — Telemetry, Analytics, Experiments, Affiliate — sitting on top of the cut-down Meta and Shopify truth you already have. Hit Harder is the app that makes processable the design principles we built the store and the campaign loop on — research, telemetry, experiments, affiliation — so the June multiple isn't a one-off miracle, it's what those principles produce when the operator can actually run them. Client handoff to Pro Spike Flow's operator is in progress; several lanes are still landing. The Telemetry and Analytics tabs carry the story behind this post. The Experiments tab is where the next month's gains come from.
What Hit Harder is, and what it isn't
Hit Harder is the loop we ran for Pro Spike Flow, generalized. The loop has three parts.
Research. What the buyer's actual intent is, what the competitive frame is, what the shipping offering needs to look like for someone to click and stay. Research is the part that decides what creative we ever bother producing. Without it, the team is making creative in a vacuum and testing in a vacuum — and a paid social budget burns down without anyone knowing why.
Telemetry + analytics. The platform part. The platform captures Meta pixel-style events, cart activity, session state — and joins them cleanly so an operator can read what's happening per-button, per-creative, per-segment. This is the part that makes the platform generic across clients. Telemetry doesn't have a Pro Spike Flow shape; it has a per-tenant shape, with tenant-specific dashboards on top.
Experiments. The reformer. The platform runs experiments on the store, not just on the ad. Cart-drawer copy, button placement, headline ordering — experiments the platform instruments live and reports back as revenue-impacting events, not as Meta-reported ROAS blurs. This is the part of the loop that produced the June number: not a single campaign creative hitting a wide funnel, but per-button reasoning hitting a narrow one.
Together: research tells you what creative is worth producing, telemetry tells you what's working, experiments tells you what's about to work. The earlier reports we wrote for Pro Spike Flow were one-offs — research plus a tight analysis, delivered as a single document. Hit Harder is that loop as a product.
Why we built this into a platform
Here's what's hard about a one-off. The data you find in a one-off proves one thing about one store. You ship the report. Then a month later the campaign changes and you can't run the same research, and the operator doesn't have a live telemetry pane to react against. You ship another one-off. You're paying for the same research twice for the same store, three times a year. The operator gets better reports but the business doesn't get better systems. That's the failure mode the platform exists to escape.
Hit Harder is the platform product. Research runs once a quarter per market segment. Telemetry runs continuously. Experiments stack on the same store through the next campaign. The operator gets a live view explaining what their decisions are doing — not a one-shot explanation that ages out the day after delivery.
For Pro Spike Flow, this is the structure we've been running for the past quarter, and the June number is the output. For the wider market we serve, this is the productization of the same work — same research, same telemetry, same experiment-driven reform loop. Different store, same loop.
What next month looks like, now that Hit Harder is live
If the operator — not us — drives the experiment loop, the next month won't look like ~19× of the retainer. It'll look like ~19× with the operator driving the loop. The Telemetry tab keeps generating the same daily decisions. The Experiments tab provides the surface where the operator runs per-button changes and watches the telemetry pane reflect the result.
If we're right, the platform widens from "we ran this" to "your team runs this." If we're wrong, the platform fails the same way one-off reports fail: it shows results for a moment and stops producing after the contract ends. The bet Hit Harder makes is that operator-driven telemetry plus experiments produces a multiple that compounds over the next month. The June number is the floor, not the headline.
We're publishing this post after one month, not a year, because the loop is now a platform instead of a service. The platform is what kept the loop running after we shipped it. Now it belongs to the operator — and the next month is the part that tells us whether the loop ran because of us, or whether it survives them.